![]()
![]()
Activity 5

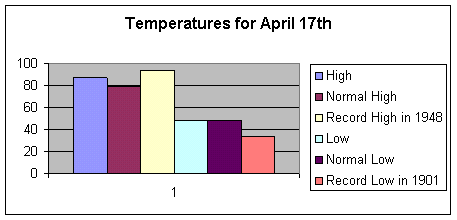
Create a weather graph that illustrates today's temperatures. Include the following categories: High, Normal High, Record High, Low, Normal Low and Record Low.
Label your graph with the date you collected the information.
![]()

![]()
Find The Temperature Information in the Weather Section of the Newspaper.
Step 1:
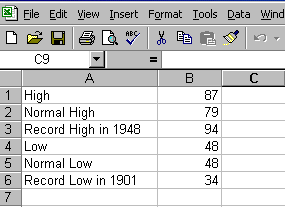
Open the program called Microsoft Excel. Type the categories in column A and then type the corresponding temperature in column B.
Step 2:
Highlight the typed information to create your graph.
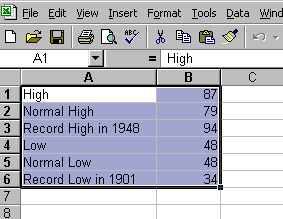
Click on the graph wizard
icon. ![]()
Continue to follow the steps listed below.
Step 3:
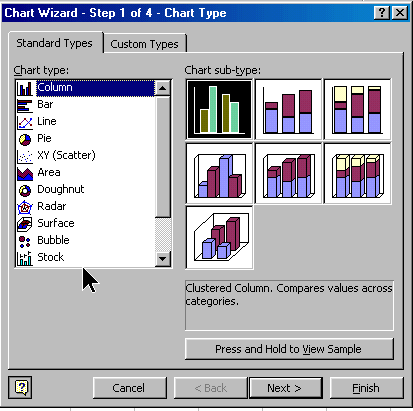
Choose the type of graph that you would like to display the weather information.
Step 4:
Select the range to be listed in columns.
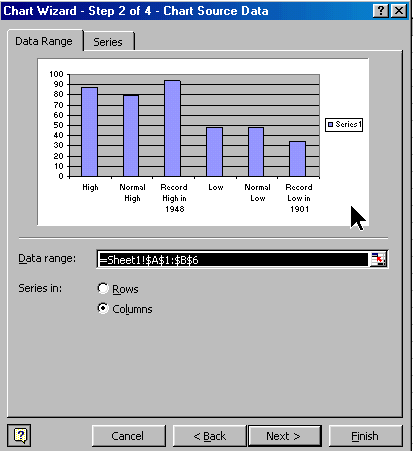
Or Rows!
Step 5:
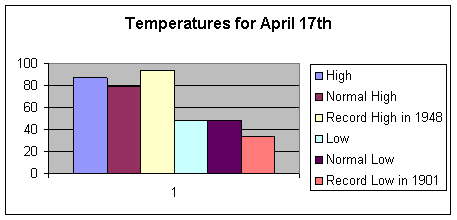
Add a Chart title which should include the date that you gathered your information.

Step 6:
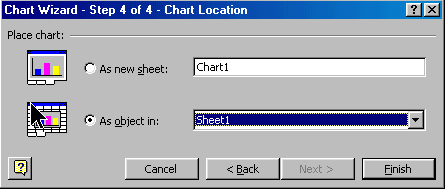
Choose the radio button that makes the graph an object.
Step 7:
The final graph will be an object that you can copy and paste into a Mircosoft Word document. Save this file in your network file. The name of the file should be Weather Graph.

![]()
Guidelines for Evaluating the MS Excel Activity
1. Students will be evaluated on their ability to produce a weather graph. Students must follow the steps to create a graph and then save the graph to their network file.
![]()